Lean Six Sigma: Engineering and Business Collide
Let me preface this article by saying I’m not the biggest fan of statistics. Taking my computational methods class, which was very heavy on statistics, was a huge challenge to me. I figured I would never need statistics again. So imagine my shock when I rolled into my Lean Six Sigma (LSS) Green Belt training and found out it was mainly statistics.
LSS is an optimization method that utilizes statistics to identify bottlenecks, reduce waste, and eliminate product defects. While it sounds like something that belongs strictly in the business world, LSS is strongly connected to engineering. Engineers are constantly trying to make their products faster, cheaper, safer, and more reliable. LSS is designed to do just that.
Here’s a rough crash course on LSS and its place in engineering.
History
In the 1980s, Bill Smith, an engineer for Motorola, started applying statistics to eliminate production defects. He was successful in connecting production to statistical analysis, thus becoming the principal founder of the Six Sigma methodology [1].
Later on, Mikel Harry—another Motorola engineer—and Bill Smith created the official Six Sigma methodology using this problem-solving approach: Measure, Analyze, Improve, and Control (MAIC). This approach was published in Harry’s book, Six Sigma: The Breakthrough Management Strategy Revolutionizing the World’s Top Corporations. At one point, the Six Sigma strategy helped Motorola save more than $16 billion [1].
As for the Lean part of LSS, Toyota is accredited for that. Their system is called the ‘Toyota Production System’ but was translated into the word ‘Lean’ by MIT researcher John Krafcik because the system needs less of everything in order to create the same amount of value [2]. Lean Thinking focuses on reducing extraneous waste and is built on these five principles:
Understand the customer and their perception of value.
Identify and understand the value stream for each process and the waste within it.
Enable the value to flow.
Let the customer pull the value through the processes, according to their needs.
Continuously pursue perfection (continuous improvement — or Kaizen in Japanese) [2].
Because of its roots in Japan, Lean Thinking uses Japanese words to describe its concepts. Their method, however, has reached a global audience.
Statistics
Engineering decisions need to be backed with justifications, so it makes sense that statistics take their rightful place in production defect prevention. Statistics works best with a large sample size, which is why LSS is best used for high-production products.
While I’m no expert on statistics, I know which types of data to use and when to use different analysis methods. In LSS, there are two types of data—quantitative and qualitative [3]. Quantitative data is numerical and can be measured, such as temperature, weight, time, or the number of defective products. Qualitative data describes characteristics or categories, such as the type of defect or whether a product passed or failed inspection.
Here’s a good model of the analysis methods:
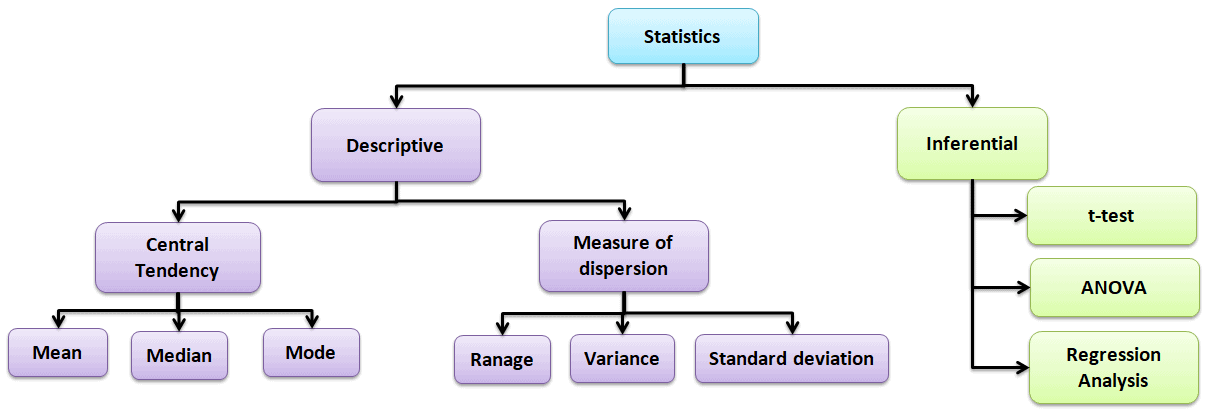
Figure 1: This figure displays the basic level statistics used in LSS [3].
While collecting statistics is important to producing solutions to production defects, how the data is displayed is just as critical. Many times, managers want information to be quick and concise. This makes choosing the right graphical tool just as important as having correct data.
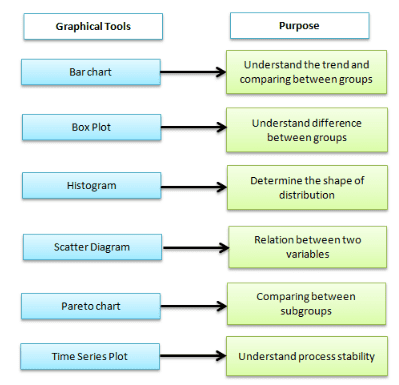
Figure 2: There are many types of graphical analysis tools, but here’s a quick overview of the types and their purposes [3].
For example, a Pareto chart can quickly show which problems are responsible for the majority of defects. A histogram can show the distribution of measurements, while a control chart can show whether a process is behaving consistently over time. Instead of handing a manager a spreadsheet with thousands of numbers, an engineer can use these tools to turn the data into a decision.
That is the point of statistics in LSS. Collecting numbers for the sake of collecting numbers does nothing, but if you use those numbers to identify problems and make better decisions, then you are doing what LSS is designed to do.
Problem Solving Methods
Of course, not every engineering problem can immediately be reduced to a spreadsheet. A handful of problem-solving methods are useful when a problem cannot be quantified right away.
For instance, there may be a communication problem between design engineering and systems engineering. While there may be measurable outcomes from these issues, such as missed deadlines or design changes, the root cause could be something much less tangible. Maybe information is being lost between departments. Maybe nobody knows who is responsible for approving a change. Maybe the two teams simply have different expectations.
Qualitative research is still valuable in these situations. Interviews, observations, brainstorming, and process mapping can help identify what is actually happening before the engineer starts looking for a numerical solution.
One of the most recognizable problem-solving tools in LSS is the Five Whys. The concept is simple: ask “why?” repeatedly until the root cause of a problem is uncovered.
For example: Imagine a machine stops working.
Why did it stop?
The motor overheated.
Why did the motor overheat?
The cooling system was not working properly.
Why was the cooling system not working?
The filter was clogged.
Why was the filter clogged?
The filter was not being replaced regularly.
Why was it not being replaced regularly?
There was no maintenance schedule.
The original problem appeared to be a broken motor, but the actual problem was a missing maintenance process. Fixing the motor would solve the immediate problem, but creating a maintenance schedule could prevent the problem from happening again.
This is where engineering and business start to collide. Engineers are trained to solve the physical problem, but LSS encourages them to look at the entire process surrounding that problem.
Implementation
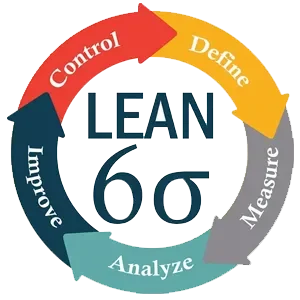
So what does implementing Lean Six Sigma actually look like? One of the most common approaches is DMAIC: Define, Measure, Analyze, Improve, and Control.
First, the problem is Defined. Instead of saying, “Our product has too many defects,” the team identifies exactly what is wrong. What product? What defect? How often does it happen? Who is affected?
Next, the team Measures the current process. This establishes a baseline and prevents the team from relying solely on assumptions. If 8% of products are defective, that number gives the team something concrete to improve.
The team then Analyzes the data to determine what is causing the problem. This is where statistical analysis, process maps, Pareto charts, cause-and-effect diagrams, and other tools can come into play.
After identifying the likely cause, the team Improves the process. This could mean changing a manufacturing process, redesigning a component, adjusting equipment, changing instructions, or eliminating an unnecessary step.
Finally, the team Controls the new process. This step is easy to overlook. A solution is not very useful if the process slowly returns to its original state six months later. Control methods make sure the improvement lasts.
DMAIC essentially creates a loop: identify the problem, understand it, fix it, and make sure it stays fixed.

Figure 3: The LSS certification goes from White Belt to Master Black Belt. Those who complete a Master Black Belt are required to complete a multi-year long project demonstrating their proficiency [1].
Why Engineers Should Care
At first glance, Lean Six Sigma may seem more relevant to business majors than engineers. But the more I learned about LSS, the more I realized that it is essentially another way of thinking like an engineer.
Engineering is about using science and mathematics to solve problems. LSS adds another layer: solve the right problem, use evidence to understand it, and make sure your solution actually improves the process.
An engineer might design a faster manufacturing process, but LSS asks whether that process creates more defects. An engineer might redesign a component to make it cheaper, but LSS asks whether the new design increases failure rates. An engineer might optimize one part of a system, but Lean Thinking asks whether that optimization creates waste somewhere else.
The goal is not simply to make something work. The goal is to make the entire process work better. That is where engineering and business collide. And maybe statistics are not so bad after all.
References
[1] "History of Six Sigma: Exploring the Roots." Six Sigma Online. https://www.sixsigmaonline.org/six-sigma-history/.
[2] “The origins of Lean Six Sigma." Royal Charter, 14 November 2017. https://www.quality.org/knowledge/origins-lean-six-sigma.
[3] Hessing, Ted. "Basic Six Sigma Statistics." Six Sigma Study Guide, https://sixsigmastudyguide.com/basic-six-sigma-statistics/.
To cite this article:
Sunday, Emelia. “Lean Six Sigma: Engineering and Business Collide.” The BYU Design Review, 16 Sep 2026, https://www.designreview.byu.edu/collections/lean-six-sigma-engineering-and-business-collide